
This is probably my favorite post to write every year. After spending the summer months crunching some data from the past NFL season (and utilizing historical numbers as well), we’re pumped to be dropping our 2023-24 NFL Season Preview in our unique way. We won’t do a team-by-team rundown or highlight major storylines; rather, we’ll take a look at some analytics around last year’s numbers, identify some regression candidates (both positive and negative) and use that data to make some predictions into what we think will happen for the upcoming season.
At the end of this post, we’ll be detailing our predictions for the full season along with some future bets we have already locked in. The first crisp fall mornings are upon us and football is here. Let’s get rocking.
The Chirp Methodology
As a brief refresher to our methodology for analytics and prediction, we’re big believers that a team’s record is not always indicative of their true performance. While this may generate some eye rolls from the “eye test” crowd, it actually validates what the eye test sees in many aspects.
One metric we’ll cite pretty religiously in this article is Overall Adjusted Performance (OAP), which is a weighted average taking into account underlying metrics to try and isolate out highly variable factors. OAP is comprised of three variables:
- Percentage of game time a team is either leading or trailing by one possession (or tied)
- Percentage of game time a team is leading by two or more possessions
- The percentage of game time a team is leading for
During the 2021-22 NFL Season, ten of the top-14 teams in OAP made the postseason. The four who missed were:
- Indianapolis Colts (#2)
- Los Angeles Chargers (#11)
- Minnesota Vikings (#12)
- Seattle Seahawks (#14)
3/4 of those teams bounced back to make the postseason this past year, despite the biggest roster upgrades being Khalil Mack for the Chargers (8.0 sacks) and TJ Hockenson mid-season for the Vikings. The Seahawks got significantly worse on paper, yet still made the postseason.
Of the four teams who were outside the top-14 and made the postseason, only two made it back: the Philadelphia Eagles (#16) and Cincinnati Bengals (#17). These are some easy explanations. Jalen Hurts took a massive jump for the Eagles, and they substantially upgraded their roster, while Joe Burrow and the Bengals built off their improbable Super Bowl run a year prior. The Las Vegas Raiders and Pittsburgh Steelers, however, both missed the playoffs with the Raiders in particular plummeting.
The year prior, back in 2020-21 (while we had a different formula for calculating OAP), 11/14 teams made the postseason. The three who missed were the Dolphins, Falcons, and Chargers; the following season, none made the postseason, although Miami and Los Angeles were both eliminated on the final weekend. Meanwhile, the three who made the postseason despite finishing outside the top-14 were Tennessee, Chicago, and Washington. Only Tennessee made the postseason the following year, with Chicago (6-11) and Washington (7-10) falling well behind pace.
OAP isn’t a perfect metric, but our attempt at providing a more accurate measure of a team’s performance beyond wins/losses has proven to be somewhat accurate. In a way, OAP is essentially a quantification of true team performance, or luck-independent performance. We’ve illustrated this point before, but our annual reminder is this: NFL games often swing on one or two possessions. It’s different from all other sports in that the season is substantially shorter (17 games) and opportunities are significantly more scarce per game, leading to huge swings in variance that oftentimes, do not have a large enough sample size to even out over a singular season. It may seem silly to think that, but this concept is really the numbers behind the eye test. Take the Minnesota Vikings last season for instance; nobody thought they were a legitimate contender, yet they had a 13-4 record. People are often turned off by analytics because of the notion that computers replace what we “see”, but in this sense, our OAP metric confirms the eye test.
Indicator #1: Overall Adjusted Performance (OAP)

This past season, only nine of the top 14 teams in OAP made the postseason, the lowest mark we’ve seen since we began to track the metric. The five teams who missed? The Detroit Lions (#8), Tennessee Titans (#9), Las Vegas Raiders (#10), Carolina Panthers (#12), and New Orleans Saints (#14). Ironically, two of these teams were eliminated the final week of the season (Detroit, Tennessee), while Carolina was eliminated Week 17. A deeper look at these teams reveals some obvious areas of positive regression this season.
For the Detroit Lions, they were the top team in OAP in the NFC North and finished 9-8 for the season. The Lions led by two or more possessions at the 7th highest rate in the NFL last season, an extremely high mark for a team that missed the postseason. You can do a quick scan of Detroit’s season and easily find one notable game that should have swung their way: Week 3 at Minnesota, where the Lions trailed for 45 seconds in total, led by 9+ points for 23.5% of the game, and lost. That result flipping in their favor would’ve put Detroit in the playoff field.
The Tennessee Titans were one of our highest ranked teams in OAP at Week 11, ranking 3rd in the metric. Injuries beleaguered the Titans in the back half, namely to quarterback Ryan Tannehill. The Titans were 6-6 when Ryan Tannehill started and 1-4 when either Malik Willis or Joshua Dobbs started. Tennessee had a brutal schedule down the stretch (six of their final seven games were against playoff opponents, three of which Tannehill didn’t start), and those were the primary games Tennessee struggled in.
We mercilessly targeted the Las Vegas Raiders a year ago in this article, as they popped in a negative way in every advanced analysis we highlighted. Fast forward to now, and the script has been flipped. During the 2021-22 season, the Raiders were 7-2 in one possession games and only 3-5 in two possession games; this past season, the Raiders were 4-9 in one possession games and 2-2 in two possession games. One would expect a team to win 50% of their one possession games and, over the past 34 game span, the Raiders have done exactly that (11-11). They just had extreme splits back-to-back years.
The Carolina Panthers were the tale of two teams this past season. At Week 11, they were 23rd in OAP, yet finished the year 12th in the metric. This may sound crazy to say, but Carolina was simply one of the most dominant teams in the NFL over the back half of the season. The Panthers were 5-3 over the final nine weeks of the season and had only three games where they trailed by two or more possessions: games against Baltimore, Pittsburgh, and Tampa Bay (for less than two minutes). The wins weren’t flukes either; they led by two or more possessions in 80% of victories, with the only one missing being a meaningless Week 18 game against New Orleans.
Lastly, the New Orleans Saints were 14th in OAP, narrowly in front of two postseason teams (Seattle and Miami). The Saints had a similar narrative to Carolina: they were bad to begin the year (24th in OAP at Week 11) but came on strong to end it. The Saints lost two games in which they led by two or more possessions; in those games they managed to trail for a combined 13 minutes (and much of that was in the 1st quarter against Tampa Bay). If those two games flip, the Saints are 9-8 and winning the NFC South.
On the flip side, the five teams who made the postseason but were outside the top-14 in OAP? The Seattle Seahawks (#15), Miami Dolphins (#16), Minnesota Vikings (#21), Tampa Bay Buccaneers (#23), and New York Giants (#25). A quick run through of each:
The Seattle Seahawks were on the flip side of this argument a year ago, finishing 14th in OAP yet missing the postseason. Seattle was mere decimals away from being #14 this year and did this despite having poor performances in one possession games (4-6). The Seahawks struggled during the middle half of the season but snuck into the postseason after winning out over the final two weeks, with Seattle’s Week 4 win over Detroit proving to be the difference maker. Being so close to the border of hitting this metric doesn’t make me believe the Seahawks are due for significant negative regression this upcoming season.
The Miami Dolphins finally got back to the postseason last year; two years ago, they were an OAP qualifier that missed the postseason. It’s tough to judge Miami’s OAP performance too harshly, as their quarterback, Tua Tagovailoa, battled recurring concussion issues all season. At Week 11, Miami was 14th in OAP; they finished 2-6 after that stretch and lost four one possession games. The Dolphins were just 1-4 with either Teddy Bridgewater or Skyler Thompson starting, yet 8-4 with Tua.
The Minnesota Vikings are the poster child for a team whose record does not match the eye test; Minnesota was a team we identified as a positive regression candidate a year prior utilizing our OAP metric, and from a record standpoint, we were spot on. From a performance standpoint, however, the Vikings arguably were a worse team with better results (hence, ending up lucky a year after we determined them to be unlucky). Minnesota was a ridiculous 11-0 in one possession games and won an insane four games in which they trailed by two or more possessions. In fact, the Vikings finished 4-4 in games which they trailed by two or more possessions, something virtually unheard of. Not to mention, but Minnesota had the 3rd highest share of game time in which they trailed by 9+ points. The only two teams worse? Indianapolis and Houston.
With Tom Brady officially gone, the Tampa Bay Buccaneers are projected to be one of the worst teams in the NFL this season. The Bucs never got their footing a year ago, as they were plagued by extremely conservative play calling and game management, plus a lack of chemistry between Tom Brady, his receivers, and his offensive line. It shouldn’t be a surprise Tampa Bay is here; just look at their last few weeks of the season. Wins against New Orleans, Arizona, and Carolina all took double digit comebacks to pull off against three teams who missed the postseason.
Lastly, the New York Giants are the team way in the back of OAP, yet not only made the postseason, but won a playoff game. Pittsburgh was 28th in OAP a year prior, so while the Giants aren’t the worst OAP team to make it, they are up there. New York was 8-4 in one possession games and consistently ranked near the top of the league in turnover luck. The Giants won three games a year ago in which they trailed by two or more possessions and ranked 30th in percentage of game time in which they led by two or more possessions. They were the prototypical team who stayed competitive in games and had a ton of bounces / plays go their way. Lightning usually doesn’t strike twice.
Indicator #2: Win Profile Matrix

The win profile matrix is another tool we use, where we highlight the quality and “legitimacy” of a team’s victories. On the X-axis we have game time leading, which refers to the percentage of a game a team is leading for; this is one of the most predictive measures in determining the winner of a game. If a team is leading for the majority of the game, one would expect them to win. On the Y-axis is one possession reliance; games can easily swing on a singular play, meaning that wins by <8 points usually aren’t as consistent of a measure of team performance as a two-possession victory.
With that background, here are some key notes. The bottom right quadrant is the most desirable, as it indicates teams that led for a large portion of time and won the majority of their games by two or more possessions. By contrast, the top left quadrant is the least desirable, as it includes teams that were more often than not losing and, when they won, more often than not won by one possession.
A few takeaways here:
- The top of the NFL last season wasn’t a façade: the San Francisco 49ers, Philadelphia Eagles, Kansas City Chiefs, Buffalo Bills, Baltimore Ravens, Dallas Cowboys, and Cincinnati Bengals all pop on this list. It’s no surprise that these teams also ranked #1 through #7 in OAP, comprised the four final teams, and represented the Super Bowl champions. The Philadelphia Eagles led for the highest percentage of game time last season, but the San Francisco 49ers were arguably just as dominant. San Francisco was 10-3 in two possession games and had the lowest one possession win reliance in the NFL. Philadelphia was 7-2 in two possession games, Buffalo and Kansas City were both 7-0, and Cincinnati was 7-1.
- The Detroit Lions once again pop here, as their win profile was quite strong: Detroit ranked 9th in game time leading, 7th in one possession win reliance, and were 5-3 in two possession games. The Lions were arguably one of the top-12 teams in the NFL a season ago and their results certainly didn’t match their true performance. The Lions weren’t beating weak teams either: Detroit beat three postseason teams by double figures and lost games to Philadelphia, Buffalo, Minnesota, Miami, and Seattle by a combined 17 points.
- Two teams to call out? The Carolina Panthers and Cleveland Browns. Both teams straddled the line of game time leading, with Cleveland narrowly leading more than trailing, while Carolina being the inverse. However, both boasted extremely strong win profiles: Carolina was 6th in one possession win reliance and won four games by 2+ possessions, while Cleveland was 2nd in one possession win reliance and won five games by 2+ possessions. Carolina was a far different team after going to Sam Darnold, but also well before when they fired Matt Rhule. Cleveland played most of the year without Deshaun Watson and with Jacoby Brissett filling in, lost five one possession games.
- The Los Angeles Chargers are in a nearly identical spot this year as they were a year ago on this matrix. For all the talk of Brandon Staley’s reckless game management costing the Chargers wins, this once again seems to refute that argument. The Chargers are nowhere near as dominant as you’d hope, especially for a team that has Justin Herbert. But their metrics back up them as a solid team: the Chargers were 11th in OAP and above average in game time leading.
- The top left quadrant is undesirable, and there are some concerning trends here. Look at the primary teams bunched up here: Indianapolis, Houston, Denver, Atlanta, Los Angeles, and… three postseason teams: New York, Tampa Bay, and Miami. A year ago, Pittsburgh and Las Vegas were in this quadrant as playoff teams, and both missed the following season. The Minnesota Vikings are dangerously close here as well, barely serving above average in game time leading.
- As a final note, the bottom left quadrant is naturally perplexing to decipher: these teams trailed more often than they led, yet when they won, they often won by two or more possessions. For teams that don’t win a lot of games (Chicago, Arizona) it’s not worth reading too much into. But… for New England, New York, and Green Bay? It’s interesting – this quadrant last year featured Philadelphia, Denver, and New Orleans, for reference. The Patriots had a positive scoring margin and were 4-4 in one possession games and 4-5 in two possession games; the Packers had basically an even scoring margin (-1) and were 4-5 in one possession games and 4-4 in two possession games, although they boasted two possession victories over poor opponents (Chicago x2, Los Angeles, Minnesota). Lastly, the New York Jets were 7-10, ranked 29th in OAP, trailed by two or more possessions at the 6th highest rate in the NFL, yet beat Miami and Green Bay by a combined 40 points. It’s why football is so hard to predict.
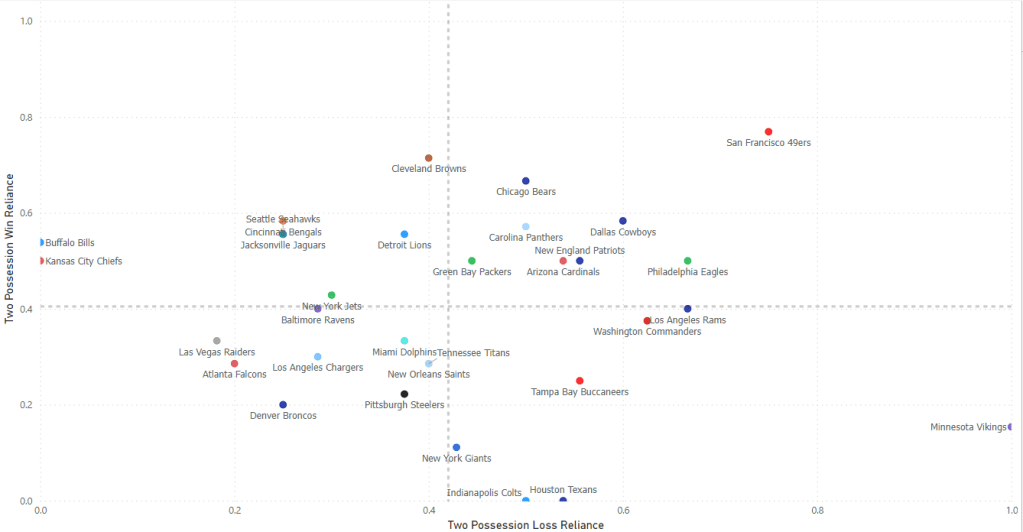
Indicator #3: Loss Profile Matrix

The loss profile matrix is close to the inverse of the previous graph, but not quite – we have the same X-axis of game time leading, but now factor in one possession loss reliance. Here, the top right quadrant is preferable, as it indicates teams that, when they lose, they often lose in the realm of highly variable one possession games (and lead for more often than they trailed). This graph is loosely a linear relationship here; as you lead for more game time, the odds of you losing by a close margin increase (if you were to lose). Looking for outliers is crucial here.
Take the Buffalo Bills for instance; all of Buffalo’s losses last season were by one possession. Their loss to the Minnesota Vikings was particularly perplexing, as Josh Allen fumbled in the end zone while trying to sneak (and run the clock out), a turnover which lost them the game. A fluke play that will rarely ever happen played a role in that singular defeat. It’s a bit of an extreme example but hammers home the point.
A few takeaways here:
- Buffalo and Kansas City stand out; neither team lost a game by two possessions a year ago in the regular season, and both performed about as expected in one possession games overall (Buffalo 6-3, Kansas City 7-3). The Chiefs were worthy Super Bowl champions, but a year after Buffalo was clearly the best team in our view by our team profiles, they once again fit into the top-5 here.
- I wouldn’t overreact too much to the bottom-right quadrant, where we see Dallas, San Francisco, and Philadelphia all here. The bulk of these three teams’ losses came by two or more possessions, but each had a small number of losses (Dallas the most with 5), and all had unique circumstances. I’d argue these teams all should’ve performed better in terms of competitiveness in losses last year.
- The Eagles had three total losses, and one was without Jalen Hurts when they lost by 10 to New Orleans. The Eagles were 7-2 in two possession games and ranked 1st in OAP and percentage of game time while leading by two or more possessions.
- San Francisco was extremely similar; the 49ers were 2nd in OAP, 3rd in percentage of game time while leading by two or more possessions and were 10-3 in two possession games. San Francisco lost by nine in the rain fest in Chicago Week 1 with Trey Lance starting and got beat badly by Atlanta and Kansas City weeks 6 and 7. Over the final eleven weeks, the 49ers went 10-0 and won seven of the games by two or more possessions.
- Lastly, the Dallas Cowboys were 6th in OAP, 6th in percentage of game time while leading by two or more possessions, and 7-3 in two possession games. Dallas was badly outplayed by Tampa Bay Week 1, but their other two losses by 9+ were to the Eagles when starting Cooper Rush, and a meaningless Week 18 road defeat to Washington. If Dak Prescott hadn’t gotten hurt last season and missed five games, I would have expected the Cowboys to be much closer in OAP to San Francisco and Philadelphia.
- Some teams that continue to pop? The Detroit Lions (62.5% of their losses by one possession), and Las Vegas Raiders (81.8% of their losses by one possession). Two teams that were both playoff-worthy by OAP, yet plagued by poor performances in one possession games that could easily have swung the other way. The Raiders did live in the one possession territory at a high rate, yet their 4-9 record was a sharp regression to the mean. If they hover around a more realistic, say… 6-6 this year? They’ll be in the thick of the wild card race. Some other teams to note in the top right quadrant includes Tennessee, Seattle, and Cleveland.
- One team we haven’t touched on? Baltimore. The Ravens were 5th in OAP last season despite Lamar Jackson only playing in eleven games. The Ravens have been a darling of ours for the past few seasons, but injury luck always hits hard. The crazy thing about the Ravens last season? Only 1.8% of their total game time last season was spent by them trailing by 9+ points, the lowest mark in the league. The Ravens never trailed by 9+ points with Lamar Jackson and didn’t until Week 15 against the Cleveland Browns. You’d wish Baltimore would dominate a bit more and they coughed up three leads last season (Miami, New York, Jacksonville), but this is one of the best teams in the NFL.
- The Miami Dolphins had a poor win profile a year ago, but their loss profile is more favorable; like the Raiders, Miami more often than not lived in the one possession territory. The difference is they performed at about expectations here, while Las Vegas did not. Miami was 6-5 in one possession games and 3-3 in two possession games, pretty fair marks that accurately reflect a lot of their other metrics. In essence, Miami’s record last year is what we’d expect to happen from a team with their underlying insights. It’s why viewing these in aggregate, rather than individually, is the best way to predict a team’s performance for next season.
- On this graph, the bottom left quadrant is where you want to avoid, and the only two playoff teams living here are the New York Giants (again) and Tampa Bay Buccaneers (again). There is a recurring theme here, but also that Minnesota is dangerously close to hitting this territory as well. The Vikings went 11-0 in one possession games and 2-4 in two possession games. I’m expecting steep regression; if Minnesota went just 6-5 in one possession games a year ago, they’re 8-9. Considering how much of a fallout we saw the Raiders undergo in a year, the same could be arriving for Minnesota and the New York Giants. The Giants were highly reliant on one possession games, going 8-4 in them. It’s similar to Miami, although the difference is the Giants overperformed expectations based on their far inferior game time leading and inability to separate from opponents. New York started 6-1 last season and ended 3-6-1, with their wins coming against Houston, Washington, and Indianapolis. We already saw some regression come their way but expect more.
- As for two notable outliers, how about the Atlanta Falcons and Denver Broncos? Atlanta tied for the most one possession games (13) and went 5-8 in them, going 2-2 in two possession games. Based on teams in a similar range by game time leading, Atlanta was supposed to lose by more lopsided margins than they actually did. This tells us that while Atlanta’s results were often close, they weren’t actually that close during the game itself. Denver had the same deal; the Broncos also played 13 one possession games and went 4-9, going 1-3 in two possession games. Denver had the second lowest percentage of time leading by two or more possessions a year ago. They often stayed competitive in games but were thoroughly unable to get ahead and expand their lead over opponents.
Indicator #4: Dominance Matrix
The dominance matrix is, in my opinion, one of the most fascinating grids we have. This past year illustrates some misleading pictures, but overall, it’s a terrific indicator of overall team success. Winning a game by two or more possessions can’t be chalked up to just luck; it’s easy to envision one play to swing a game or a lead. But multiple ones? Much more difficult.
For interpretation, the top left quadrant is where you want to be. These are teams who saw the majority of their victories come by two or more possessions and have the majority of their losses come by one possession. In simpler terms, when these teams won, they often won big, and when they lost, they often lost small. The bottom right quadrant is the least desirable; when these teams won, they often won small, and when they lost, they often lost big. The top right: when these teams won, they often won big, and when they lost, they often lost big. And bottom left are the teams who really relied on one possession games, often winning or losing in a close game. In this quadrant, I think identifying teams with drastic splits in win % in one possession games is crucial.
Here are a few highlights:
- It shouldn’t be a surprise to see Buffalo, Kansas City, and Cincinnati all in the desirable quadrant. We touched on San Francisco, Philadelphia, and Dallas’ misleading two possession loss areas, which is why they’re to the right. One team to note? The Jacksonville Jaguars. Jacksonville’s dominance profile was eerily similar to Cincinnati’s in terms of end results and while they weren’t truly as dominant for the year (Cincinnati ranked 5th in dominance, Jacksonville 9th), they were a top-10 team. Since 2011 (CBA changes), QBs entering the third year of their rookie contract experience the biggest spike in win percentage and team performance. Trevor Lawrence is entering his third season and coming off a year where Jacksonville won a playoff game. I’d keep a close eye on this team.
- The Detroit Lions once again pop here, and they ranked 8th in our dominance metric for the year. Detroit was 4-5 in one possession games, yet 5-3 in the two-possession variety. Those are strong splits and coupled with their game time performances, they are a strong bet on positive regression next season.
- The Cleveland Browns ranked 2nd in the NFL last season in percentage of victories by 2+ possessions, but only 21st in our dominance metric. This is a case of Cleveland’s results actually being misleading relative to their performance, something we don’t usually see in this metric. Cleveland won five games by 10+ points, but only led by two possessions or more for 11.5% of their game time, a mark hovering around teams like Tampa Bay, Minnesota, and the Los Angeles Rams. That is… not good, and likely an indicator the Browns weren’t as impressive in a results (and scoring margin) standpoint as we envisioned last year.
- Similar to the Browns, the Seattle Seahawks ranked 16th in our dominance metric, yet were 5-3 in two possession games and ranked high in two possession win reliance. That’s a hard feat to achieve for a team that won nine games; Seattle beat Arizona twice by 2+ possessions, and also beat the Jets and Giants, two of the worst teams in the league according to our metrics. I’m skeptical of just how dominant the Seahawks were last season, even if their profile boasts a strong image.
- One team that barely snuck into the dominant quadrant? The New York Jets, who arguably have the most hype amongst any team in the NFL entering the season. The Jets were bad in nearly every metric last season, but pop here. How is that the case? Well, the volume of their two possession victories is highly misleading; they ranked 28th in our dominance metric, 27th in total competitive time, yet managed to go 3-4 in two possession games. The Jets were able to shave two possession losses into one possession losses multiple times last season: they cut into two possession leads with under two minutes two times, which single handedly moved them into a better quadrant.
- The Minnesota Vikings being lumped in with Tampa Bay, Washington, Los Angeles, Indianapolis, and Houston isn’t a good sign for their upcoming season, nor is it for the New York Giants who are in the same quadrant. The eye test backs this up for both teams: Minnesota was 11-0 in one possession games and didn’t lose a single game by less than 11 points (until the postseason). The Vikings ranked 22nd in our dominance metric last season. The New York Giants were even worse, ranking 26th and going 8-4-1 in one possession games and 1-3 in two possession games. If I had to bet on two teams to not only decrease their win total, but do it by multiple games, it would be the Giants and Vikings.
- The bottom left quadrant we mentioned is important while reviewing one possession performance. A quick rundown of results:
- Baltimore: 6-5 (7th in dominance)
- Las Vegas: 4-9 (13th in dominance)
- Atlanta: 5-8 (30th in dominance)
- Los Angeles: 7-5 (17th in dominance)
- Denver: 4-9 (31st in dominance)
- Pittsburgh: 7-5 (23rd in dominance)
- New Orleans: 5-6 (15th in dominance)
- Tennessee: 5-6 (12th in dominance)
- Miami: 6-5 (11th in dominance)
- It sure feels like Pittsburgh, Atlanta, and Los Angeles overperformed expectations in one possession games, while Baltimore, Las Vegas, and Tennessee underperformed.
Indicator #5: One Possession Matrix

This one is quick, as this graph is the inverse of the dominance matrix. Just to call out a few teams we haven’t touched on much yet:
- The Cincinnati Bengals were a team we gave a hard time to entering last season, as it felt like they were not truly as good of a team as their record indicated. However, they were significantly better last season; Cincinnati was 5th in dominance, 7-1 in two possession games, and a few plays away from another Super Bowl performance. Based on historical data, Cincinnati did peak record wise last year with Burrow in his 3rd year, but Cincinnati’s metrics backed up their 12-4 record in a strong way.
- It feels like it’s an annual rite of passage for us to recommend the Washington Commanders’ win total going under, yet Ron Rivera quietly pulls a Mike Tomlin performance every year and makes the team overachieve and be competitive. Washington was, once again, a team that was near the bottom of the league in a variety of metrics: they were 24th in our dominance metric, were 5-3-1 in one possession games, and beat up some bad opponents (Chicago, Indianapolis, Houston, Atlanta). They are always a perplexing team for us, as they also beat three postseason teams (Philadelphia, Jacksonville, Dallas) by a combined 37 points.
Using Team Profiles to Predict the 2023-24 Season
In addition to our matrices and composite profiles, we also build a generic model to predict a team’s wins. There are some drawbacks to this; first, it doesn’t account for individual games/opponents, and two, it shouldn’t be thought of as a perfect goal. Rather, finding the consistent patterns and threads across all analyses is where the juicy tidbits are. Last season, we outlined the six teams who overachieved the most in our model and the six teams who underachieved the most. Here are the following statistics of it:
- 1/6 overachieving teams made the postseason (Miami)
- 4/6 overachieving teams went under their win total
- 2/6 underachieving teams made the postseason (Seattle, New York)
- 4/6 overachieving teams went over their win total
This year’s teams are as follows:
| Team | Model Projected Wins | Wins Above Expected |
| Kansas City Chiefs | 11.40 | +2.60 |
| Minnesota Vikings | 10.55 | +2.45 |
| Cincinnati Bengals | 10.27 | +1.73 |
| Buffalo Bills | 11.74 | +1.26 |
| Los Angeles Chargers | 8.80 | +1.20 |
| Pittsburgh Steelers | 7.81 | +1.19 |
| Houston Texans | 5.82 | -2.82 |
| Los Angeles Rams | 6.68 | -1.68 |
| Las Vegas Raiders | 7.67 | -1.67 |
| New Orleans Saints | 8.64 | -1.64 |
| Indianapolis Colts | 5.59 | -1.59 |
| Denver Broncos | 6.24 | -1.24 |
I certainly am not insinuating that many of the overachieving teams will miss the postseason next year; there’s a reason why the teams with a lot of wins are clustered there. It’s hard to win that many games, just like many of the underachieving teams are some of the worst in the league. The key ones I’m identifying here? The Vikings (who pop everywhere as a regression candidate) and Raiders (who pop everywhere as a positive regression candidate). Some others are interesting bets (more on those later), but I think that’s the major takeaway: it’s hard to win 14 games and hard to win only 3 or 4 games.
All of these analyses leads into our overall predictions, which can be found below:
AFC Predictions:
It’s hard for me to see a scenario where the Kansas City Chiefs are not at the top of the AFC again. Patrick Mahomes has shown an elite ability to perform regardless of his supporting cast or surrounding roster. The Chiefs likely won’t be as efficient in the red zone this season and Chris Jones’ holdout is concerning for a defense that is still far from top tier, but this is Patrick Mahomes and Andy Reid we’re talking about. All of our metrics indicated Kansas City was a top team a year ago and, on paper, they didn’t have many notable departures. As long as they have a healthy Mahomes, they should be near the top of the conference year in, year out.
My surprise team to climb up to #2? How about the Jacksonville Jaguars. I’m all in on the Jags this season; no, their profile wasn’t as impressive as Buffalo, Cincinnati, or Baltimore, but this is a team that has clear lines of improvement this season. Trevor Lawrence should take another substantial step forward in his development, especially with the addition of Calvin Ridley. The defense is a question mark, but it’s also a talented group with lots of young talent. And historical data tells us that team performance peaks with a quarterback entering Year 3 of his rookie contract. Jacksonville plays in one of the weakest divisions in football and could easily go 5-1 against the conference. If you want a dark horse Super Bowl bet, look no further. Their +2800 odds are far too low.
At #3, I’m still high on the Buffalo Bills. It feels like Buffalo has lost some hype after a disappointing end to last season combined with all of the buzz around the New York Jets, but this is still a top-5 team in our metrics. A major key for the Bills’ success is having a healthy Von Miller, as Buffalo’s pressure rate plummeted with him off the field last season. I’m not as high on the Jets as others and think that, if Buffalo’s defense can stay healthy and if Josh Allen doesn’t tear his UCL again, that the AFC East still runs through Orchard Park.
It likely isn’t a surprise to Chirp readers that I’ve got the Baltimore Ravens winning the AFC North over the Cincinnati Bengals this year. I’m super high on Baltimore’s offense, as new offensive coordinator Todd Monken is sure to unlock a group that features arguably the most dynamic quarterback in football outside of Patrick Mahomes, plus a significantly fortified receiver room. The Ravens’ offensive line remains elite; if their secondary can stay healthy (a big if) and some young pass rushers emerge, I don’t think it’s a stretch to say the Ravens are the best team in the AFC. Right ow, they’re not. But they have the highest ceiling of any team in the conference in my opinion.
If the Cincinnati Bengals don’t win the division for the third year in a row, then they’ll be the primary wild card team. I’m not trying to pick on Cincinnati, but I just always fall in love with the underlying metrics behind the Ravens’ profile more. I think Joe Burrow is overrated, but he’s still a top-10 quarterback with a lot of firepower to work with. Lou Anarumo, to me, is the most important person on the team not named Burrow. Cincinnati’s defense has been fantastic with him at the helm, and he’ll need to continue to out scheme opponents as the Bengals begin to lose some talent due to the impending cap crunch.
I’m extremely excited to watch the Los Angeles Chargers‘ offense being led by Kellen Moore this year. Moore did a terrific job in Dallas and now gets to work with Justin Herbert and a bevy of weapons. The Chargers’ offense underwhelmed last season, in large part due to a litany of injuries to Herbert, Keenan Allen, Mike Williams, and Rashawn Slater. Here’s hoping that isn’t an issue this season. The Chargers have the potential to be a top-3 offense in the NFL. I get concerned seeing the historical drop-offs teams have with their rookie QB entering Year 4 of their rookie deal, but the improvements Los Angeles has made makes me optimistic they’ll be a dangerous team out in the AFC.
A surprise team I’ve got in the playoffs? The Tennessee Titans. By our OAP metric, Tennessee should’ve been a playoff team a year ago and for much of last season, they were a good football team. Things fell apart a bit with a tough schedule combined with Ryan Tannehill’s injury, but this season, the Titans have better quarterback insurance and more offensive firepower with DeAndre Hopkins. There’s nothing terribly impressive about Tennessee on paper, but Mike Vrabel consistently juices the most he can out of this roster. Considering similar iterations of this team has been to the postseason rather consistently, I’m surprised to see so many people writing them off.
- Kansas City Chiefs
- Jacksonville Jaguars
- Buffalo Bills
- Baltimore Ravens
- Cincinnati Bengals
- Los Angeles Chargers
- Tennessee Titans
- New York Jets
- Las Vegas Raiders
- Miami Dolphins
- Cleveland Browns
- New England Patriots
- Pittsburgh Steelers
- Denver Broncos
- Indianapolis Colts
- Houston Texans
NFC Predictions:
By the end of last season, I think the San Francisco 49ers were the best team in football, a rather remarkable feat considering their starting quarterback was a rookie who earned the title of “Mr. Irrelevant”. I don’t know if Purdy is as good as people think he is, but Sam Darnold is one of the top backups in the game and in Kyle Shanahan’s offense, things are easy for quarterbacks. San Francisco is loaded at the skill positions offensively (Christian McCaffrey, Brandon Aiyuk, Deebo Samuel, George Kittle) and are built properly along the trenches, including adding Javon Hargrave via free agency, who wis one of the best interior defensive linemen in football. Health is a concern here and maybe the defense takes a slight step back with DeMeco Ryans gone, but the amount of top-end talent here is ridiculous, in large part because of the salary savings they have at quarterback.
I think people forget just how dominant the Philadelphia Eagles were last season. They were #1 in the league in a ton of our metrics: OAP, dominance (by a lot) and led by 9+ points for 32.1% of their total game time, which is ridiculous. So, why do I have Philadelphia below San Francisco? Well, history tells us team performance peaks in Year 3 when a roster has a quarterback under rookie contract, and Jalen Hurts is entering Year 4, where team records usually fall. My hunch? Because they start losing top talent in free agency. Philadelphia lost starters Miles Sanders, Isaac Semualo, Javon Hargrave, TJ Edwards, Marcus Epps, and Chauncey Gardner-Johnson in free agency, along with both coordinators. Now, Philadelphia will probably upgrade at running back and will be fine along the offensive and defensive lines, but there was a decent amount of talent out the door. Combined with anticipated regression, it’s why I have Philadelphia a hair below San Francisco for the #1 seed. The majority of proven defensive playmakers are at the tail ends of their prime.
This shouldn’t be a surprise based on our analyses, but the Detroit Lions are our NFC North winner and #3 seed. There’s a pretty sizeable gap in my opinion between San Francisco, Philadelphia, Dallas, and the rest of the NFC, but the Lions certainly lead that next tier. I’m not sure that Jared Goff is really as good as we saw last year, but Detroit’s coaching staff, particularly offensive coordinator Ben Johnson, is so fantastic it may not matter. The Lions added a few nice pieces on offense for Goff to work with (Jahmyr Gibbs, Sam LaPorta, David Montgomery, Marvin Jones Jr.) and were a playoff team by our metrics last season. Dan Campbell is really building something strong and sustainable in Detroit. They’re a fun team to root for that is due for a big season.
The NFC South is probably the weakest division in football, and taking the New Orleans Saints to win it feels like the safe pick. New Orleans was playoff caliber by our metrics a year ago and regardless of what you think about Derek Carr, he is an upgrade over Andy Dalton. Chris Olave is a budding star at receiver and despite the Saints’ recurring cap woes, their roster is still good enough to emerge out of this divisional pack.
I already alluded to it, but the Dallas Cowboys are my clear #1 wild card spot. I think there’s a decent chance they could even win the division, although I didn’t love the decision to replace Kellen Moore with Brian Schottenheimer. Dallas is due for red zone regression and with a downgrade at play caller, I wouldn’t be surprised for the Cowboys’ defense to carry this team. Still, there is a ton of talent here on both sides of the ball, a running back in Tony Pollard due for a massive breakout campaign, and a defense that generates a high percentage of turnovers. If everything comes together perfectly for Dallas, they are on the short list of Super Bowl contenders. That is a big if, however.
I was a bit surprised to see our metrics look upon the Seattle Seahawks in a strong manner last season, but given the weak conference, I like them to once again be in the postseason. Geno Smith was pretty good as a starter last season and there’s a lot of talent around him; his wide receiver trio of DK Metcalf, Tyler Lockett, and rookie Jaxon Smith-Njigba is one of the best in football, plus he has a terrific offensive line to protect him. Nothing is flashy about this Seattle team and they faded a bit down the stretch. But they are competitive in games, weren’t a lucky team last season, and have a clear path back to the postseason.
Honestly, it’s anyone’s guess who gets the final NFC playoff spot. I’ll take a shot on the Carolina Panthers however, as they really popped in our metrics, where OAP indicated they were playoff worthy. Carolina benefits from playing in the weak NFC South, but I’m also a big Bryce Young believer, even if rookie quarterbacks’ teams usually struggle in the first season. The receiving core and offensive line are questionable, but the Panthers defense has a ton of young talent and Frank Reich is an underrated head coach who has compiled a strong staff. This is my sleeper team to make some noise in the NFC.
- San Francisco 49ers
- Philadelphia Eagles
- Detroit Lions
- New Orleans Saints
- Dallas Cowboys
- Seattle Seahawks
- Carolina Panthers
- Green Bay Packers
- Atlanta Falcons
- Washington Commanders
- Los Angeles Rams
- New York Giants
- Chicago Bears
- Minnesota Vikings
- Tampa Bay Buccaneers
- Arizona Cardinals
Bonus: Historical QB Research
Every year, we highlight some findings around our data studies of quarterbacks on rookie contracts. A few years ago, one of our first articles proposed a radical approach to team building where we advocated for turning over quarterbacks at a more frequent clip than teams are currently doing. A high bar should be in place for teams to set in paying a quarterback; Patrick Mahomes this past season was the first quarterback ever to win a Super Bowl while taking up more than 12.5% of a team’s salary cap.
The CBA changed in 2011 to introduce rookie scale contracts; we have compiled data on every quarterback who has a prolonged starting stint over a sizeable sample and drafted from 2011 on. The findings are… interesting. While wins are not a quarterback stat, our theory is that when a quarterback is taking up a fraction of the salary cap is when the team should have the best roster. Therefore, a team’s best roster should come during the rookie scale contract years, while in the latter years, the quarterback has to be good enough to make up for that margin of error sacrificed in order to pay his salary. Take the Chiefs for example; with Mahomes’ salary on the books, Kansas City couldn’t afford to pay players like Tyrann Mathieu, Tyreek Hill, Orlando Brown Jr., and Charvarius Ward. Yet, Mahomes was good enough to still win another Super Bowl; Brown was on the roster last season, but the three others were not.
In our findings, we found the following win percentages for teams with QBs on rookie scale contracts:
- Year 1: 42.07% (8/45 made postseason)
- Year 2: 53.76% (16/40 made postseason, two Super Bowls)
- Year 3: 60.90% (19/31 made postseason, one Super Bowl)
- Year 4: 51.38% (9/24 made postseason)
- Year 5: 57.01% (6/17 made postseason)
- Year 6: 48.41% (2/11 made postseason, one Super Bowl)
What’s more interesting is from a betting standpoint, drastic splits in over/unders that we’ll be looking to capitalize on:
- Teams with a rookie QB in Year 2 go over their win total 60% of the time since 2011
- (40 team sample size)
- Teams with a rookie QB in Year 3 go over their win total 55% of the time since 2011
- (31 team sample size)
- Teams with a rookie QB in Year 4 go under their win total 75% of the time since 2011
- (24 team sample size)
- Teams with a QB in Year 6 go under their win total 64% of the time since 2011
- (11 team sample size)
I’d caution attacking that trend with “Year 6” QBs, as the sample size gets a bit small, but the rest are extremely interesting trends. And they’ve held true in recent years even as teams’ understanding around roster building advantages with a rookie quarterback have become more mainstream. 4/4 “Year 3” QBs (Cincinnati, Miami, Los Angeles, Philadelphia) made the postseason last year (we did not count Jordan Love, as GB was paying Aaron Rodgers serious money and Love wasn’t starting). The prior year it was 1/2 (Arizona), and the year before that it was 3/4 (Baltimore, Buffalo, Cleveland).
We should also note that our study includes contract years for quarterbacks and when the quarterback’s roster was built around a rookie scale contract. An example of this is not factoring in any Green Bay Packers’ statistics over the past three seasons because while they had Jordan Love, they were clearly building their roster around paying Aaron Rodgers top tier money. It is also why we are not including the New York Jets as a “Year 3” quarterback, because they used those cap savings to pay Aaron Rodgers (and eliminate their rookie QB scale).
Here are where teams fit in the rookie QB spectrum:
- Year 1: Carolina Panthers (Bryce Young), Houston Texans (CJ Stroud), Indianapolis Colts (Anthony Richardson)
- Year 2: Pittsburgh Steelers (Kenny Pickett), Atlanta Falcons (Desmond Ridder), San Francisco 49ers (Brock Purdy)
- Year 3: Jacksonville Jaguars (Trevor Lawrence), Chicago Bears (Justin Fields), New England Patriots (Mac Jones)
- Year 4: Cincinnati Bengals (Joe Burrow), Miami Dolphins (Tua Tagovailoa), Los Angeles Chargers (Justin Herbert), Green Bay Packers (Jordan Love), Philadelphia Eagles (Jalen Hurts)
- Year 5: Arizona Cardinals* (Kyler Murray), New York Giants (Daniel Jones)
- Year 6: Buffalo Bills (Josh Allen), Baltimore Ravens (Lamar Jackson)
Future Bets We’re Taking & Predictions
San Francisco 49ers to Win the Super Bowl (+1000)
We detailed this one already, but San Francisco has a loaded roster and has consistently been in the mix. Down the stretch last season, they were one of the most dominant teams in football. I’m surprised to see they are tied for 4th best odds for the Super Bowl; in my opinion, they should be closer to Philadelphia (+800) and Buffalo (+900) from an odds perspective.
Jacksonville Jaguars to Win the Super Bowl (+3000)
Jacksonville has the 12th best odds to win the Super Bowl, which makes zero sense to me. They are entering the prime years of trevor Lawrence’s rookie contract, have a young defense with lots of talent, and fortified their skill positions with Calvin Ridley and rookie running back Tank Bigsby. If Trevor Lawrence continues to develop, they’ll be right in the mix of being able to hoist the Lombardi Trophy.
Kansas City Chiefs to Win AFC (+350)
I don’t love this bet, but you can bet three teams to win the AFC (including Kansas City) and if any one wins, you profit. This is a cheap way to get some exposure to Patrick Mahomes making another Super Bowl appearance.
Baltimore Ravens to Win AFC (+1000)
No surprise I have a lofty Baltimore Ravens future here, but if Todd Monken can open up this passing offense, the Ravens have a chance to be extremely explosive. There is some hesitancy here around the health of their secondary, along with placing confidence in David Ojabo and Odafe Oweh to get consistent pressure on the quarterback, but the Ravens have proven to be a top-7 team over the past 4-5 seasons rather consistently. These odds are too high for me to not take a shot on the value here.
Jacksonville Jaguars to Win AFC (+1500)
Dallas Cowboys to Win NFC (+600)
I think there is a clear top three in the NFC and Dallas being +600 to win the conference works in a similar manner to the Kansas City bet, as it’s a nice way to get some exposure to a top team.
Baltimore Ravens to Win AFC North (+235)
Chiefs/49ers Division Winner Parlay (+160)
Unless you think the Los Angeles Chargers are going to topple the Kansas City Chiefs, this feels like a bet with terrific value. Not many clear alternatives exist outside of these teams winning their divisions.
New Orleans Saints to Win NFC South (+130)
Carolina Panthers Over 7.5 Wins (-105)
Chicago Bears Under 7.5 Wins (+110)
The Chicago Bears are entering Year 3 of the Justin Fields era, where we’ve historically seen the largest jump in team win percentage and teams hit the over 55% of the time. But, this line is set too high in my opinion. For the Bears to hit eight wins (+5 increase from last season), it would be tied for the 3rd highest win increase by a rookie scale quarterback (out of the 31 we tracked). The three who made a jump that high? Colin Kaepernick (+7 and didn’t start full year prior), Jalen Hurts (+6), and Cam Newton (+5). All three made the postseason the year prior too; the Bears did not. This feels high by 1-2 wins.
Cincinnati Bengals Under 11.5 Wins (-144)
Teams with a rookie scale quarterback as their starter (and who they are building their team around) go under their win total 75% of the time in Year 4 since the CBA changes of 2011. I’ll blindly follow that trend until it starts to fail.
Cowboys / Jaguars 10+ Win Parlay (+166)
Las Vegas Raiders Over 6.5 Wins (+110)
One of the most obvious positive regression candidates by our metrics, if the Raiders continue to play ~12 one possession games a year and win the expected 50% of them, that puts them at six wins off the bat. I don’t think Jimmy Garoppolo is that substantial of a downgrade off Derek Carr.
Los Angeles Chargers Under 9.5 Wins (+104)
Why am I taking this under? Partly the Year 4 system, but also over the past four seasons, there have been fifteen teams who have been overly reliant (compared to league average) on one possession victories and have made the postseason. The following year, 10 (66.7%) have gone under their win total. The Chargers were one of those teams last season. I’ll follow both of the systems here.
Miami Dolphins Under 9.5 Wins (-110)
The Miami Dolphins are the same system bet(s) as the Chargers – Year 4 of the rookie scale QB and a postseason appearance despite below average one possession reliance. Not to mention, Miami’s roster is extremely top heavy and already has an injury to star corner Jalen Ramsey.
Minnesota Vikings Under 8.5 Wins (+104)
Regression is clearly already baked into this line, but I’m not sure enough is incorporated. If the Vikings went just 7-4 in one possession games a year ago, they only finish 9-8. If Minnesota were to play eleven one possession games again this season, theory tells us they’d go 0-11 to hit the historical average of ~50% win rate in one possession games. But, how far can you go on theory alone? If Minnesota goes 4-7 in one possession games this season, they likely hit this under. I’ll take that chance (plus, they fit the one possession reliance system above).
New England Patriots Over 6.5 Wins (-140)
I wouldn’t take this line at 7.5, but 6.5 feels a bit low. New England was horrific in red zone efficiency a year ago and is bringing in Bill O’Brien for the offense. We see jumps in win percentage during Year 3 of the rookie scale quarterback timeframe. I’ll take a chance on that here at a juicy 6.5 line.
New York Giants Under 7.5 Wins (-118)
Same one possession system as above, plus all of our metrics indicate the New York Giants were nowhere near as good as their record last year showed. Even 7-10 makes this a winning bet; I don’t think New York will be bad, but they don’t need to be downright awful for this best to cash.
Philadelphia Eagles Under 11.5 Wins (-115)
I think the Philadelphia Eagles will again be very good, but the Year 4 system strikes again and I’m blindly tailing it. However, I also see the angle here: they lost multiple starters on both sides of the ball and both coordinators. 11-6 is still a really good record, but it also leads to us have a winning ticket.
Tennessee Titans Over 7.5 Wins (-125)
We’ve got the Tennessee Titans as a postseason team, and I really like this future. Our metrics were high on the Titans a year ago and they play in a really weak division that features Indianapolis and Houston. If the Titans grab three wins there, they only need to go 5-8 against the rest of their schedule for this to hit. That’s manageable considering their crossover opponents are against the weakest division in football, the NFC South.
Carolina Panthers to Make Playoffs (+205)
Tennessee Titans to Make Playoffs (+210)
Las Vegas Raiders to Make Playoffs (+390)
Do I think the Las Vegas Raiders will make the playoffs? No. But, I think this is a good value bet. I think the Raiders could win around 8-9 games, which likely pushes them right into the thick of the postseason race fairly deep into the season. If a swing game or two falls their way, perhaps they even sneak in with that record. This is one where, come Week 15, I think would have much worse odds on the book to grab than you could get it for now.
Jaguars / Lions to Make Playoffs Parlay (+138)
Minnesota Vikings to Miss Playoffs (-122)
At -122 odds! This is my favorite bet of the offseason.
Miami Dolphins to Miss Playoffs (-110)
Bonus Picks
Super Bowl: San Francisco 49ers OVER Baltimore Ravens
Biggest Surprise: Jacksonville Jaguars (lose AFC Championship to Baltimore)
Biggest Disappointment: New York Jets (miss playoffs)
MVP Winner: Lamar Jackson
Offensive Player of the Year: Tony Pollard
Defensive Player of the Year: Nick Bosa
Coach of the Year: Doug Pederson
Offensive Rookie of the Year: Bryce Young
Defensive Rookie of the Year: Deonte Banks
Comeback Player of the Year: Damar Hamlin
